A-Level Economics: After the Ferry, Unemployment in a Coastal Town
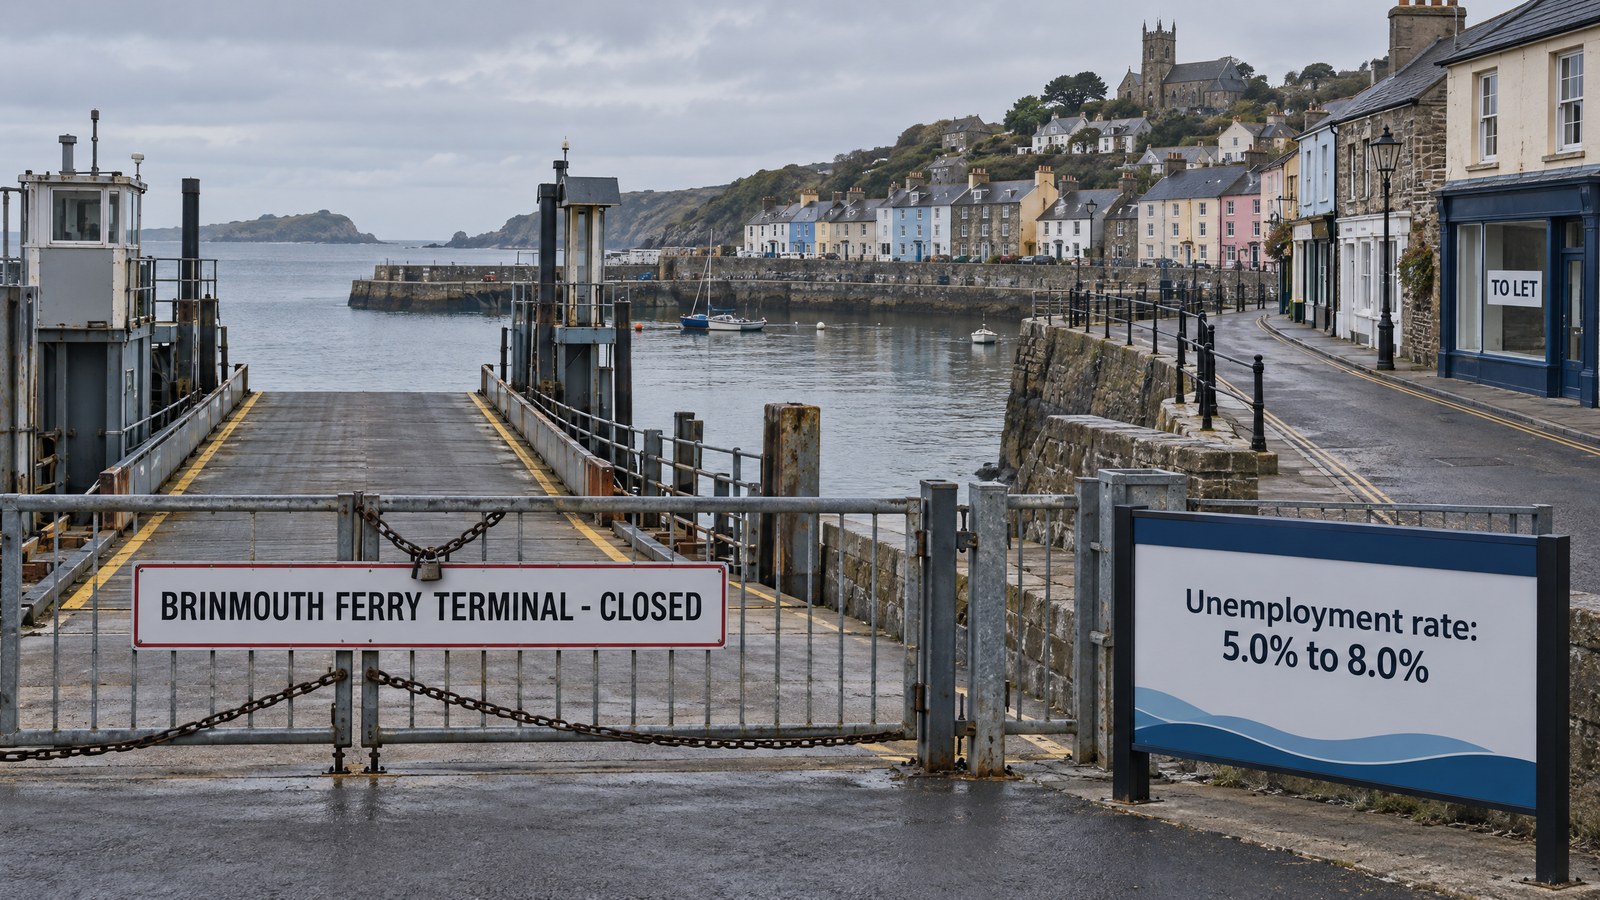
Students calculate employment, unemployment and inactivity rates for a coastal town after its ferry terminal closes, compare the claimant count with the ILO measure, sort the causes of unemployment in pairs and decide which policy would help most.
A-Level-Economics-Unemployment-Coastal-Town-Student
A-Level-Economics-Unemployment-Coastal-Town-Teacher
Want more like this?
Edexcel A level Economics, Theme 3: all 24 lessons for £13, about 54p a lesson. Eight original cases with learner pages, a teacher guide and full worked answers, as PDF and editable Word.
Original cases, not exam board questions. Not endorsed by any exam board.
What students do
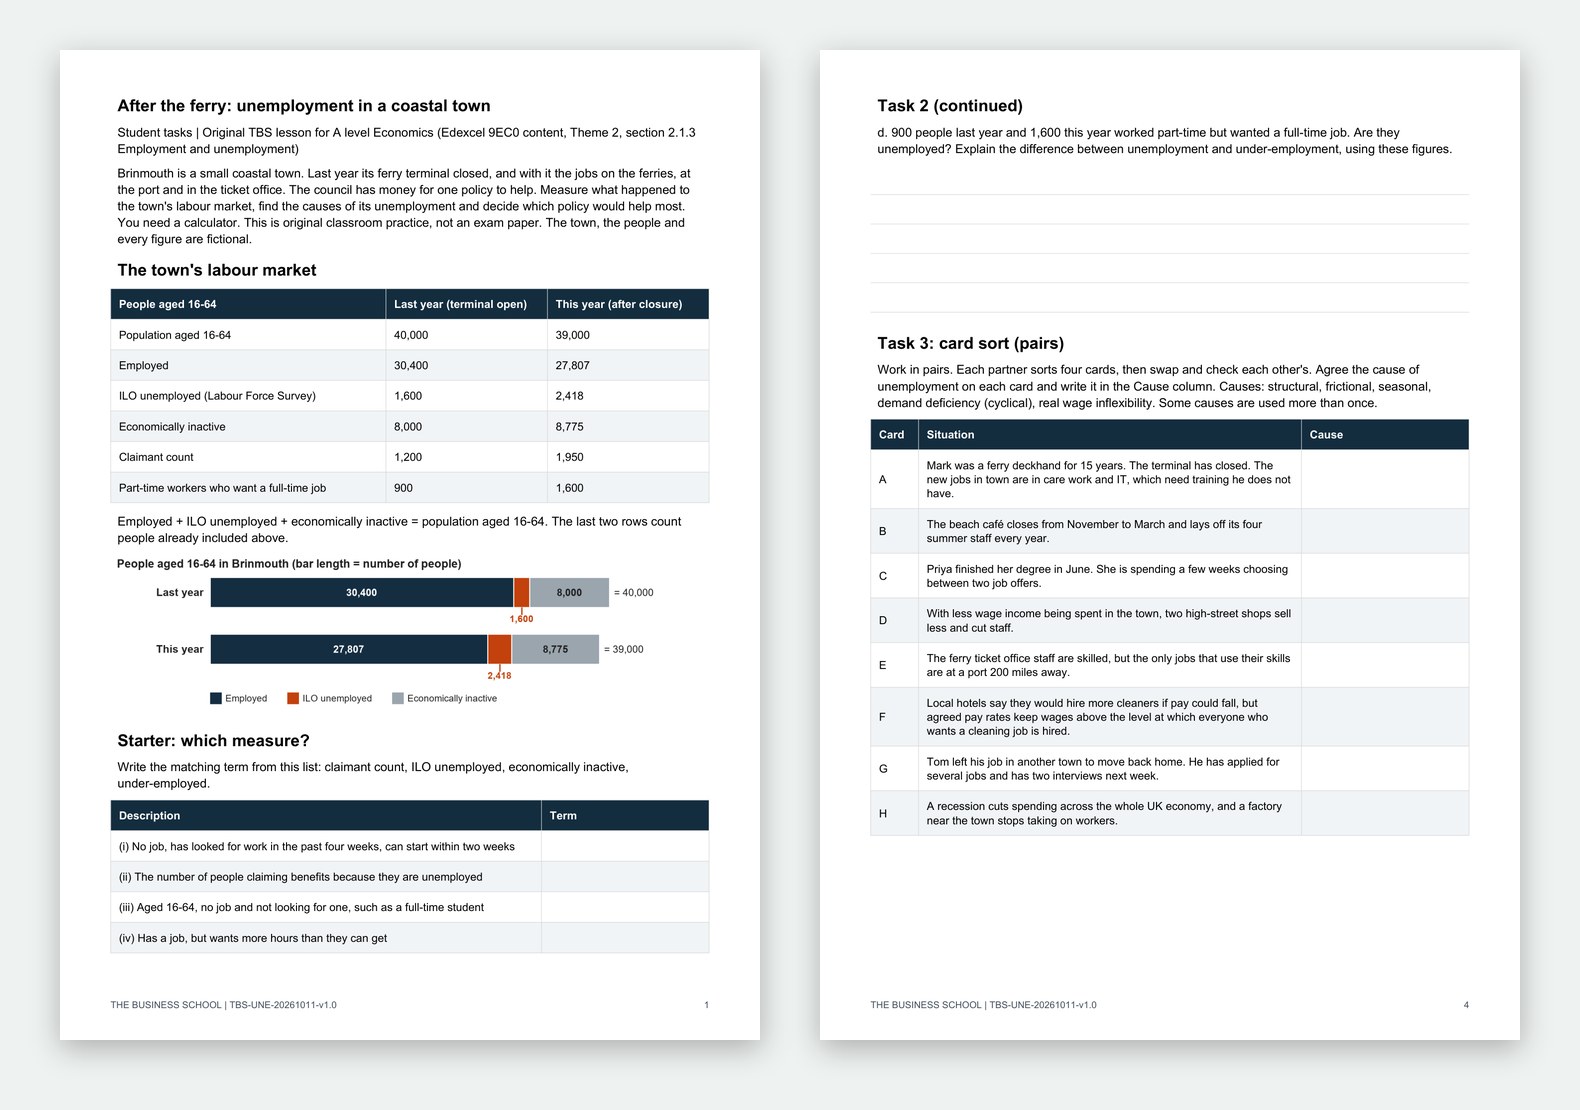
- Match the claimant count, ILO unemployed, economically inactive and under-employed to their meanings
- Calculate employment, unemployment and inactivity rates for two years and the percentage point change
- Explain why the claimant count and the ILO measure differ, and how under-employment differs from unemployment
- In pairs, sort eight cards by cause of unemployment, then judge which of three policies would best help the town
What the teacher gets
- A lesson plan for about 55 minutes of tasks, with a shorter 45-minute version. Allow longer in the timetable for handing out and feedback
- Worked answers for every calculation and card, with common errors
- Indicative guidance for the written judgement. It is not an exam board mark scheme and carries no marks or grades
- Editable Word versions of both files, so you can change the town’s figures or the policies
Specification
Edexcel A level Economics A (9EC0), Theme 2, section 2.1.3 Employment and unemployment: the claimant count and the ILO and Labour Force Survey measures, unemployment and under-employment, changes in the rates of employment, unemployment and inactivity, and the causes of unemployment, with policy names from 2.6.2 and 2.6.3. Checked against the Pearson specification, Issue 2, October 2016. The town and every figure are fictional, and all three rates use people aged 16-64 for simplicity. This is not a Pearson resource, and the lesson has not yet been tested in a classroom.
Free, no sign up. Share it with your department. See the rest of the library.